powered by
AWEKAS


You can add Awekas Stationsweb as an App! Press share  followed by "Add to Home Screen"
We use cookies to make our website as user-friendly as possible. With your consent, you allow us to offer you the full content of this website
more information
Stationsweb help
Content
Statistical graphics
Climograph Walter/Lieth
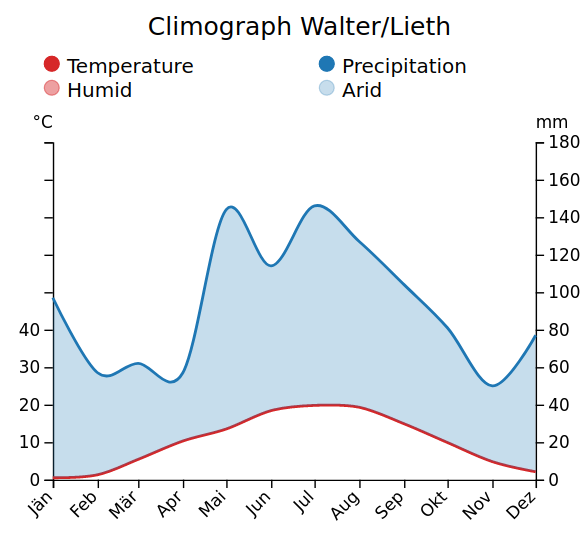
This plot shows the average temperature and
rain sum over all sent months. Humid and arid periods are shaded. The data
is refreshed every 24 hours.
Required data: At least one year with each month having at
least 80% uptime.
Climograph
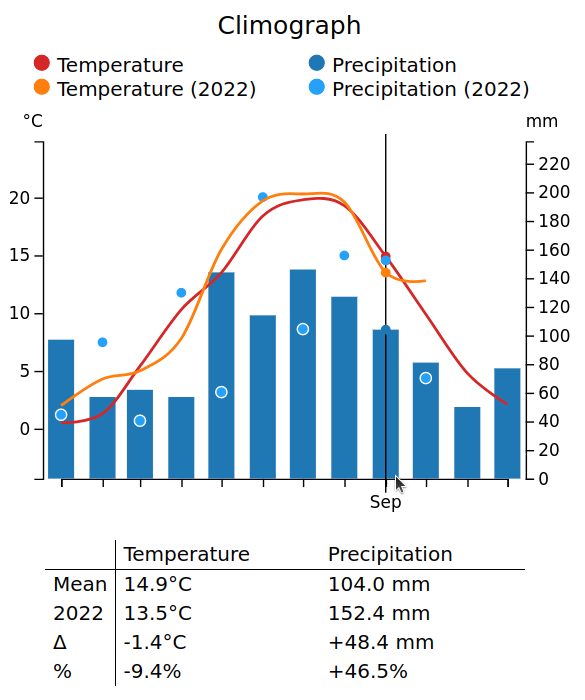
This plot shows the average temperature and
rain sum over all sent months. For comparison the data for the current
year is also shown. The value table shows the absolute and relative
differences from the average to the current year. The data is refreshed
every 24 hours.
Required data: At least one year with each month having at
least 80% uptime. For the values of the current year months with at least
50% uptime are required.
Annual values
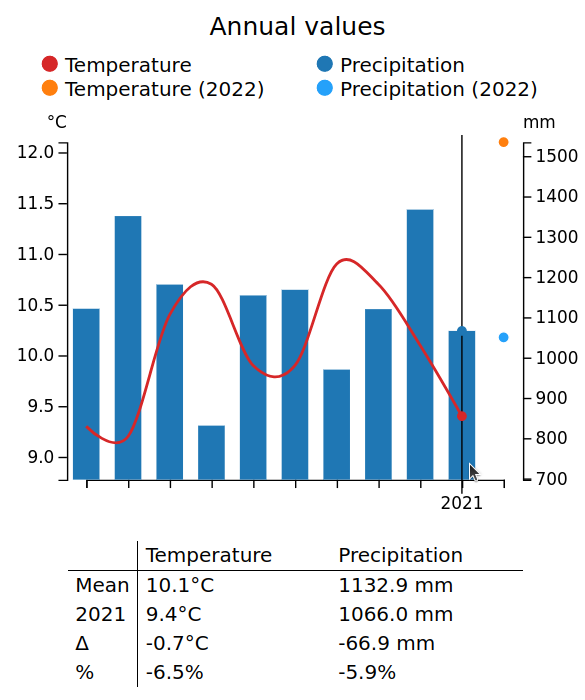
This plot shows the yearly average temperature
and rain sum. The values of the ongoing year are also shown. In the value
table overall averages for temperature and rain are shown, as well as the
differences from the overall averages to the curently hovered year. The
data is refreshed every 24 hours.
Required data: At least two past years with more than 80%
uptime each.
Solar radiation
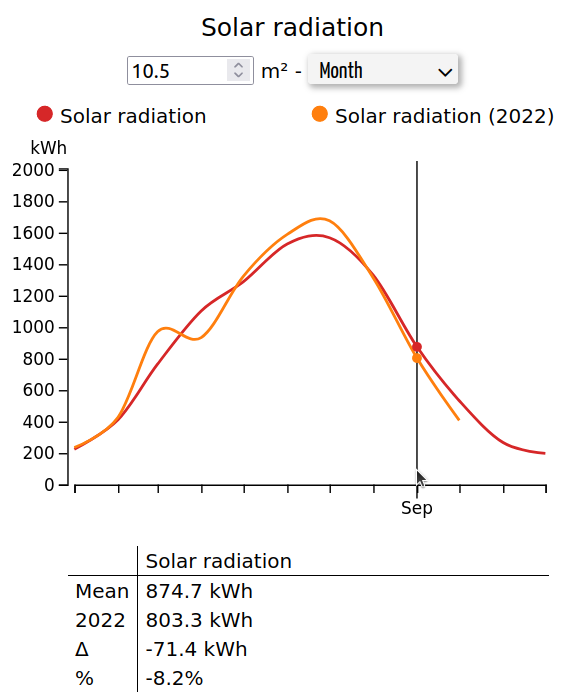
This plot shows the solar energy per year or the
average solar energy per month. Additionally, values of the current year
are shown for comparison. The input field can be used to scale the values
to a arbitrary area. Please note that this plot uses the data delivered by
the solar sensor and real world yield from a solar power system may differ.
The data is refreshed every 24 hours.
Required data: At least one year with each month having at least 80%
uptime.
Climatological days
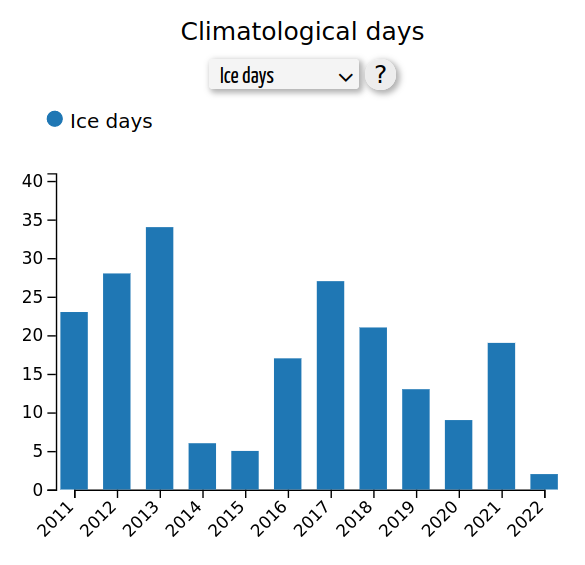
This plot shows the climatological days as used
by the German meteorological service (Deutscher Wetterdienst) or the
Austrian meteorological service (Central Institution for Meteorology and
Geodynamics). The available climatological days are: frost days (min.
temp. < 0°C), tropical nights (nightly. min. temp. ≥ 20°C), heat days
(max. temp. ≥ 30°C), summer days (max. temp. ≥ 25 °C), rainy days
(precipitation ≥ 0.2mm), storm days (max. gust ≥ 70 km/h), sunshine hours
(avg solar radiation ≥ 120 W/m²). The data is refreshed every 24 hours.
Required data: At least 48 hours per year.
Boxplot
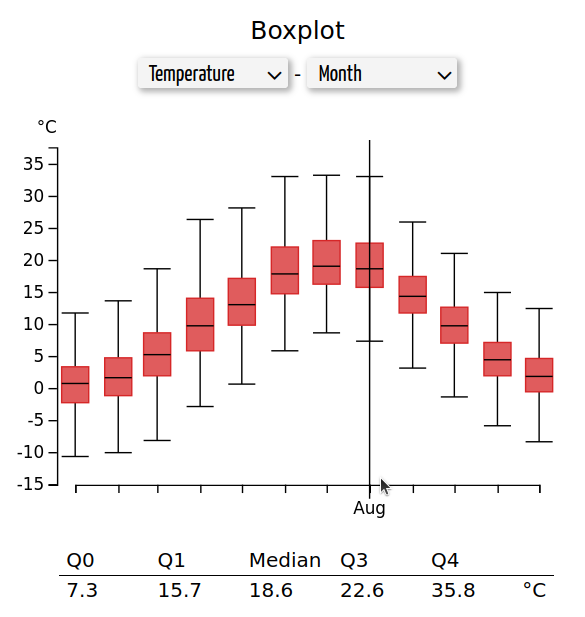
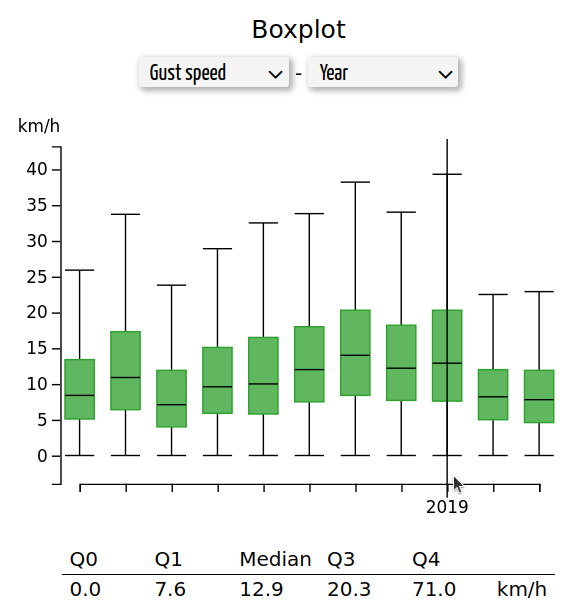
This plot shows boxplots for selected sensors:
temperature, humidity, air pressure, wind, gust, all additional
temperature sensors, all additional humidity sensors, particular matter).
The grouping is either years or months. For the 0th and 4th quartile the
Tukey's method is used. Meaning these quartiles are not necessarily the
minima or maxima but instead at most the 1.5x interquartile distance. For
the calculation of the quartiles all observerd values for one period are
used. The data is refreshed every 72 hours.
Required data: Months: at least one month with 80% uptime, years:
at least one year with 80% uptime.
Heatmap
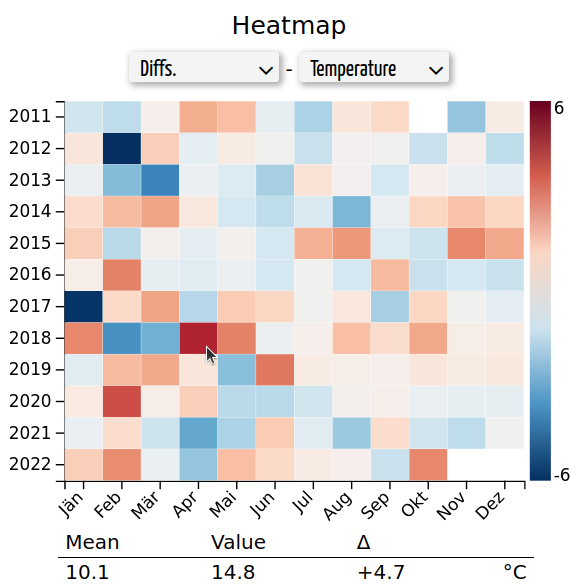
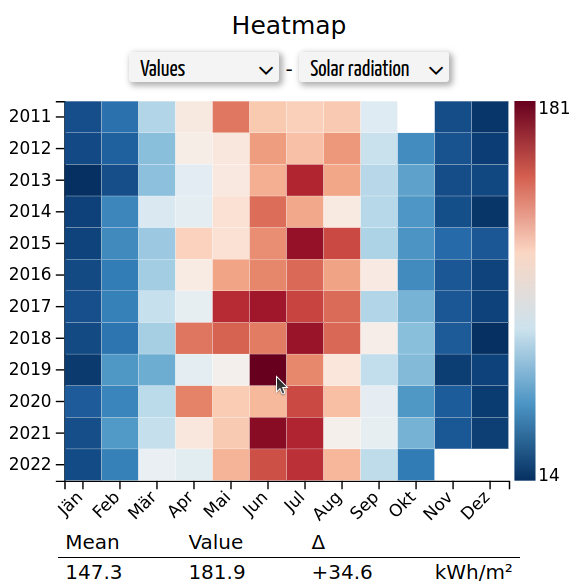
This plot shows the absolute values or deviation
from the monthly average for all months and years for temperature,
percipitation and solar power. The value table shows the monthly average,
the value for the currently hovered month/year as well as the difference
between the two. The data is refreshed every 24 hours.
Required data: At least one full year with each month having at
least 80% uptime.